Continuous monitoring with the detail you need
Round-the-clock checks, full outage diagnostics, targeted alerting, and certificate tracking, all included with every account.
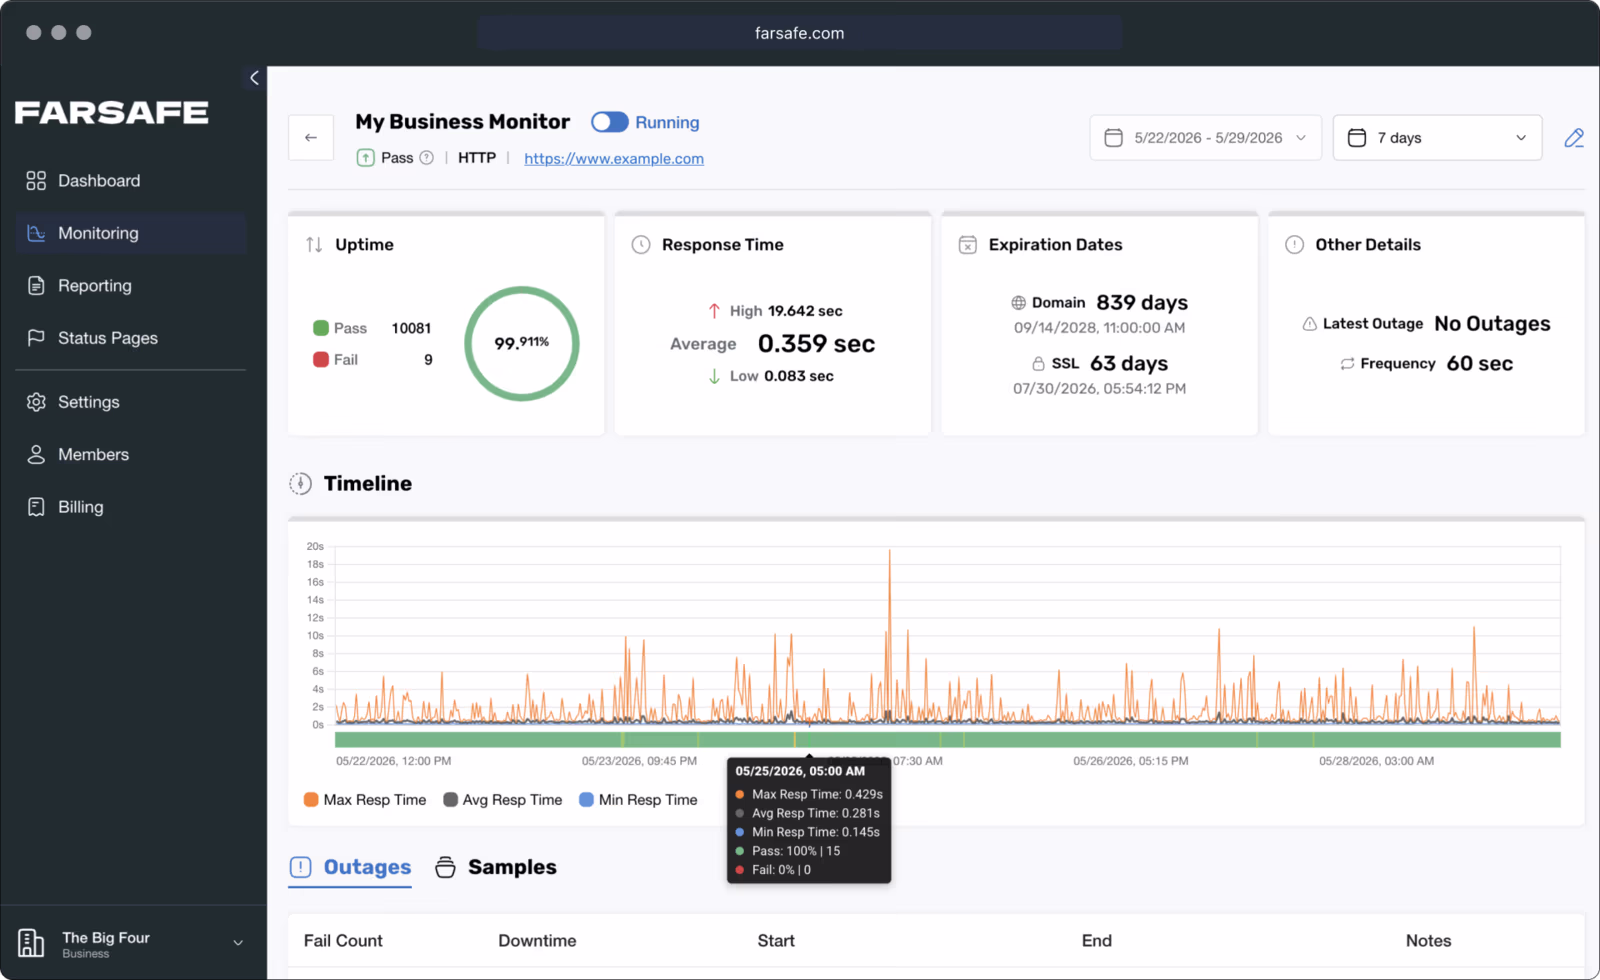
Uptime Monitoring
Our 24/7 monitoring system probes your assets every 60 seconds from multiple global locations and instantly alerts you when a failure is detected.
- Check frequency from every 1 to 60 minutes
- Multi-region checks with configurable probe locations
- Uptime percentage tracked over any custom date range
- Response time trend graph with High, Average, and Low lines
- Configurable consecutive-fail and consecutive-pass thresholds
Detailed Outage Reporting
Every outage is logged with full diagnostics: fail count, exact downtime duration, start and end timestamps, and a step-by-step breakdown per check.
- Outage log with fail count and total downtime duration
- Per-check step breakdown: DNS resolve, connect, response
- Timing in milliseconds for each diagnostic step
- Probe server location recorded for every check
- Per-sample status, runtime, and timestamp history
Targeted Alerts
Assign alert levels to each probe so notifications reach the right people at the right time. Acknowledge outages to suppress repeat noise.
- Alert levels: None, Low, Medium, High, Critical
- Repeat alert interval from disabled up to 60 minutes
- Skip alerts for already-acknowledged outages
- Annotate outages with notes visible to the whole team
- Acknowledgement checkbox to mark issues as known
Domain & SSL Certificate Monitoring
Track SSL certificate and domain registration expiry for your HTTP and email probes. Get preemptive alerts before lapses cause disruptions.
- SSL certificate expiration countdown on every web probe
- Domain registration expiry tracking with exact date
- Preemptive alert lead time configurable up to 30 days
- Separate thresholds for certificate vs. domain expiration
- Alerts delivered via any connected notification channel
A check type for every service you run
From web pages and APIs to mail servers, network devices, and raw ports, you can configure exactly how each service is verified.
Website Monitoring
Monitor web pages and API endpoints over HTTP/HTTPS with full control over request method, headers, body, authentication, and response validation.
- HTTP methods: GET, POST, PUT, DELETE, HEAD, PATCH
- Custom request headers and request body
- Response body matching and status code validation
- Basic auth (username/password) support
- Max redirects (0–6) and response timeout (100ms–30s)
Up to 12 months of history, always at your fingertips
Every check result is stored so you can revisit any time window and understand service performance, including uptime percentage, response time trends, outage details, and per-sample logs.
Custom date ranges
Query any time window from the last hour out to your full retention period using the built-in date range picker.
Response time trends
Timeline chart shows Max, Average, and Min response times over the selected period so you can spot degradation early.
Full outage history
Every outage within the window is listed with fail count, total downtime, start/end timestamps, and per-check diagnostics.
Per-check sample log
Individual check results including status, runtime, probe server, and timestamp, retained for every probe within your account history.